Dashboards


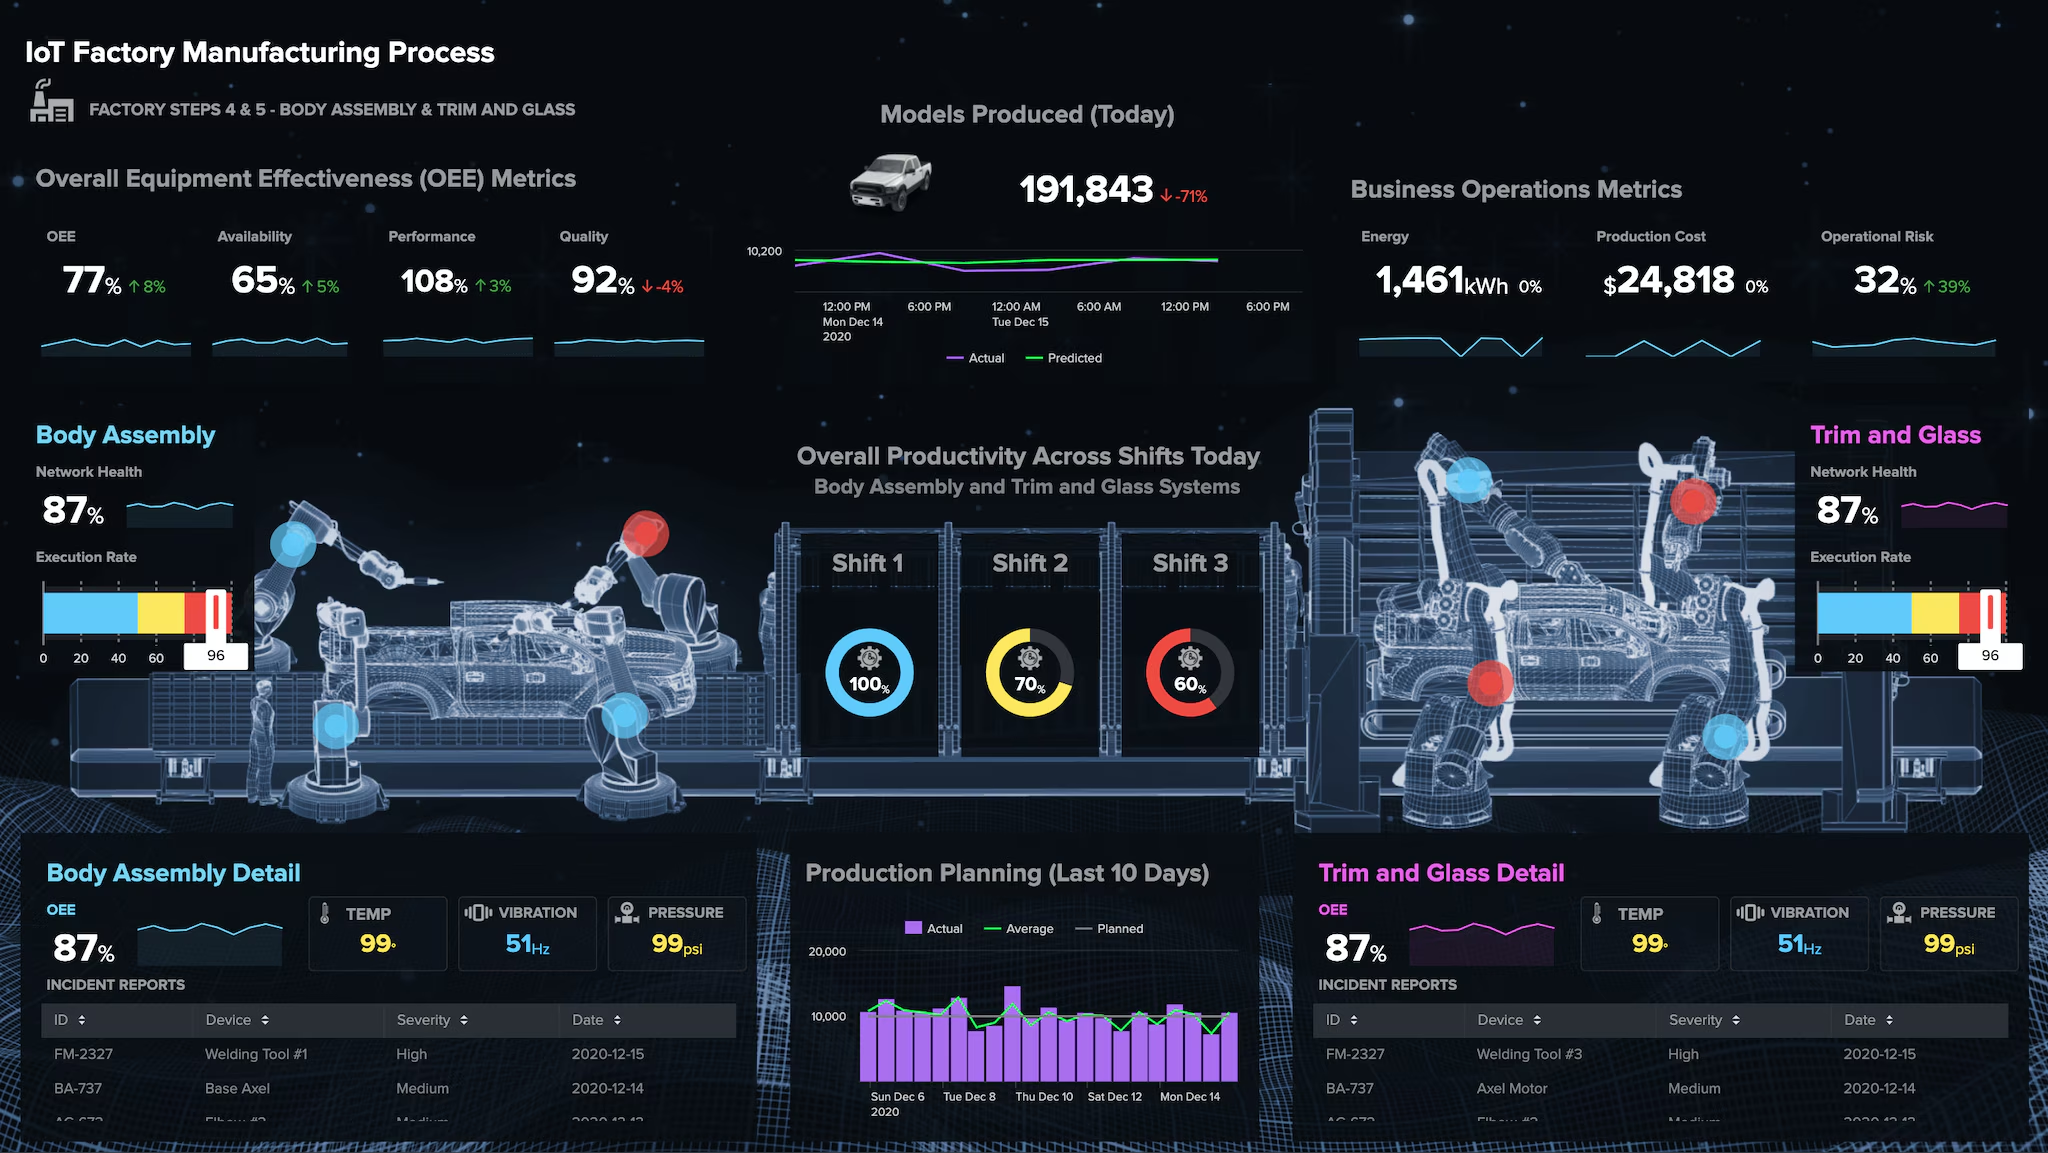
We develop results visualization dashboards
Our visualization solutions allow you to clearly see the main results of each tool.
Creation of dashboards
We take care of generating visualization dashboards that allow the user to analyze advanced indicators in a clear and elegant way.
Integrated KPI
It is key to generate performance indicators (KPI) integrated in a dashboard to evaluate the performance of the solution and the evaluated processes.
Versatile tools
We use different visualization tools depending on the client's infrastructure and operational requirements.
How do we implement visualization dashboards?
01
It is essential to understand the visualization requirements of our clients and the type of use that will be given to each tool.
02
We analyze the types of connections to be established in order to generate efficient ingest and pre-processing processes.
03
We design the dashboards in such a way as to take care of the usability criteria, so that the tools are as user-friendly as possible.
Software we work with


